Business Intelligence Dashboards in 2026: How to Turn
Business Data Into Smarter Decisions
Introduction
Modern businesses generate a large
amount of data every day. Sales transactions, customer interactions, website
visits, marketing campaigns, and financial activities all produce information
that can help companies understand their performance.
However, having access to data does
not automatically make business decisions easier. Information is often spread
across different applications, spreadsheets, and databases. Reviewing
everything manually can take valuable time and make it difficult to identify
important trends.
This is where business intelligence
dashboards become useful.
Business intelligence dashboards
help organizations transform complex information into clear visual reports.
Instead of reviewing multiple spreadsheets, managers and employees can use a
centralized dashboard to monitor important business metrics, identify changes,
and understand how different areas of the company are performing.
In 2026, BI dashboards are becoming
increasingly important as businesses adopt cloud analytics, automation, and
artificial intelligence.
Whether you operate a small
business, manage a marketing team, or work for a large organization,
understanding how BI dashboards work can help you make better use of your data.
In this guide, we will explore what
business intelligence dashboards are, how they work, their main benefits,
essential features, popular tools, and best practices for creating effective
dashboards.
What
Are Business Intelligence Dashboards?
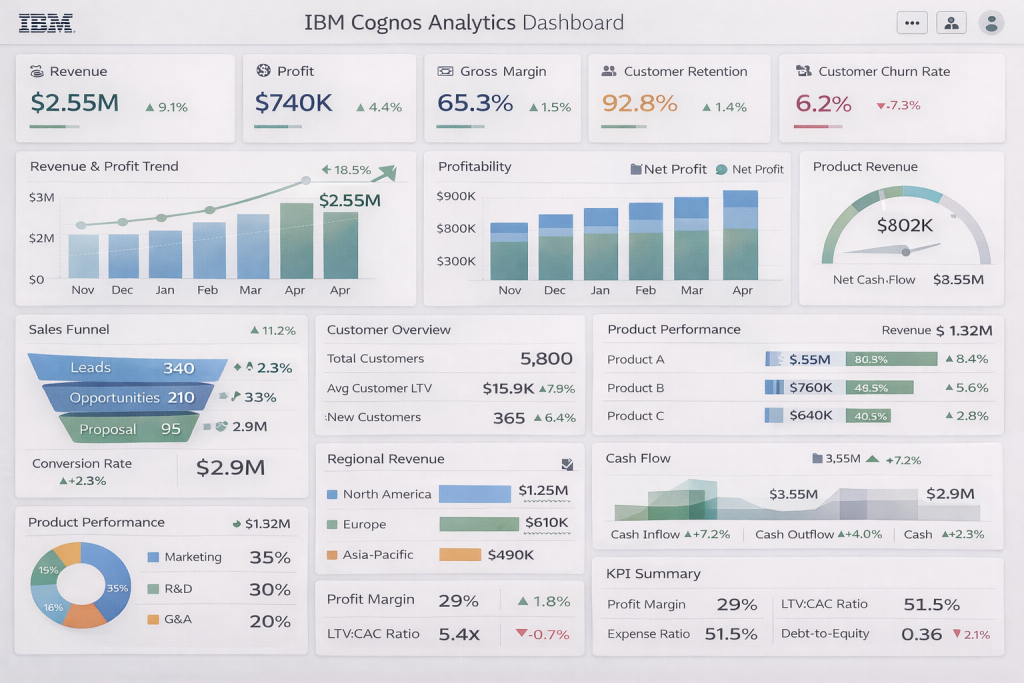
A business intelligence dashboard is
a visual interface that displays important business information in one place.
It uses charts, graphs, tables,
indicators, and other visual elements to help users understand business
performance.
A BI dashboard typically connects to
one or more data sources, collects relevant information, and presents the
results in an organized format.
For example, an ecommerce business
may use a dashboard to monitor:
- Total sales revenue.
- Number of completed orders.
- Average order value.
- Website traffic.
- Customer conversion rates.
- Best-selling products.
- Marketing campaign performance.
Instead of opening several
applications to review these metrics, employees can access a dashboard and see
the information together.
The main purpose of a BI dashboard
is to make business information easier to understand and use.
How
Business Intelligence Dashboards Work
Business intelligence dashboards use
several connected processes to transform raw information into useful visual
insights.
1.
Data Collection
The process begins by collecting
information from different sources. These sources may include spreadsheets,
databases, CRM systems, ecommerce platforms, financial applications, and
marketing services.
2.
Data Integration
Information from different systems
is connected so that users can analyze it together.
For example, a retailer may combine
sales data with inventory information to understand which products generate the
most revenue and whether stock levels are sufficient.
3.
Data Processing
Before displaying information, BI
systems may clean, organize, transform, and calculate relevant data.
This step helps make reports more
consistent and reduces problems caused by duplicated or incomplete records.
4.
Data Visualization
The dashboard presents information using
charts, tables, graphs, and performance indicators.
Users can often filter information
by date, product, location, department, or other business categories.
5.
Business Analysis
Managers and employees review the
dashboard to identify trends, investigate unusual changes, and make informed
decisions.
The dashboard becomes more valuable
when the information is accurate, relevant, and connected to specific business
objectives.
Why
Business Intelligence Dashboards Are Important
BI dashboards provide several
advantages for companies that want to improve reporting and business
performance.
1.
Provide a Clear View of Business Performance
A dashboard gives users a
centralized view of important metrics.
Business owners can monitor revenue,
expenses, sales performance, and customer activity without reviewing multiple
reports separately.
This makes it easier to understand
the overall condition of a business.
2.
Save Time on Manual Reporting
Preparing reports manually can
require hours of collecting information, organizing spreadsheets, and creating
charts.
BI dashboards can automate parts of
this process by connecting directly to supported data sources.
Depending on the platform,
dashboards can also refresh information automatically.
3.
Support Faster Decision-Making
When important metrics are easy to
access, managers can investigate business problems more quickly.
For example, if sales decrease in a
particular region, a manager can use the dashboard to compare product
performance, customer activity, and marketing results.
4.
Improve Team Collaboration
Different departments can use shared
dashboards to understand performance and work toward common objectives.
Sales teams can monitor revenue
targets, marketing teams can review campaign performance, and finance teams can
analyze expenses.
5.
Identify Business Trends
Visual reports make it easier to
recognize patterns over time.
Companies can compare monthly sales,
identify seasonal demand, and understand changes in customer behavior.
6.
Improve Accountability
Dashboards can help employees
understand how their work contributes to business goals.
When performance indicators are
clearly defined, teams can monitor progress and identify areas that need
improvement.
Common
Types of Business Intelligence Dashboards
Different dashboards serve different
purposes. Businesses should select dashboard types based on the information
they need to monitor.
1.
Executive Dashboards
Executive dashboards provide a
high-level overview of company performance.
They are designed for business
owners, executives, and senior managers who need to understand important
metrics without reviewing every operational detail.
Common metrics include revenue
growth, profitability, operating expenses, customer growth, and overall
business performance.
2.
Sales Dashboards
Sales dashboards help sales teams
monitor revenue, orders, conversion rates, and sales targets.
They can also display information
about individual sales representatives, customer segments, and product
performance.
These dashboards help managers
understand which products and sales channels are performing well.
3.
Marketing Dashboards
Marketing dashboards provide
insights into advertising campaigns, website traffic, leads, and customer
acquisition.
Common metrics include:
- Website sessions.
- Cost per click.
- Conversion rates.
- Customer acquisition cost.
- Advertising return on investment.
- Lead generation performance.
Marketing teams can use this
information to evaluate campaigns and improve marketing strategies.
4.
Financial Dashboards
Financial dashboards help businesses
monitor their financial condition.
They may include revenue, expenses,
profit margins, cash flow, outstanding invoices, and budget performance.
These dashboards can support
financial planning and help business owners identify unexpected changes.
5.
Operational Dashboards
Operational dashboards focus on
daily business activities.
For example, a manufacturing company
may use an operational dashboard to monitor production output, equipment
performance, delivery schedules, and inventory levels.
These dashboards are especially
useful for businesses that need to monitor ongoing processes.
6.
Customer Service Dashboards
Customer service dashboards help organizations
understand support performance and customer satisfaction.
Common metrics include response
times, ticket volume, resolution rates, customer satisfaction scores, and
unresolved support requests.
They help managers identify service
problems and improve customer experiences.
Essential
Features of an Effective BI Dashboard
A good dashboard should provide
useful information without overwhelming users.
Here are some important features to
consider.
Interactive
Data Visualization
Charts, graphs, and tables help
users understand business information.
Interactive features allow employees
to filter reports, compare categories, and explore specific details.
Real-Time
or Frequent Data Updates
Some businesses need current
information to monitor important activities.
Depending on the data source and
platform configuration, dashboards may support real-time, near-real-time, or
scheduled updates.
Customizable
Reports
Different teams need different
information.
A sales manager may focus on revenue
and conversions, while a finance manager may need expenses and profit margins.
Customizable dashboards allow users
to focus on the metrics most relevant to their responsibilities.
Data
Integration
An effective BI dashboard should
connect to relevant business systems.
Common sources include spreadsheets,
databases, CRM platforms, ecommerce applications, and marketing tools.
Mobile
Accessibility
Mobile-friendly dashboards allow
authorized employees to review important business metrics from smartphones and
tablets.
This can be useful for managers who
travel or work across multiple locations.
Security
and User Permissions
Dashboards may contain sensitive
financial, customer, or operational information.
Businesses should use appropriate
access controls so employees only see information they are authorized to
access.
Popular
Business Intelligence Dashboard Tools in 2026
Several BI platforms provide
dashboard creation and data visualization capabilities.
1.
Microsoft Power BI
<ins>Microsoft Power
BI</ins> is a popular business intelligence platform that allows users to
create interactive dashboards and reports.
It supports multiple data sources,
data modeling, and integration with Microsoft products.
Best for: Businesses that use Excel and other Microsoft services.
2.
Tableau
<ins>Tableau</ins> is
known for its advanced data visualization capabilities.
It allows users to build interactive
dashboards and explore complex information through visual reports.
Best for: Organizations that prioritize visual analytics and data
exploration.
3.
Looker Studio
<ins>Looker Studio</ins>
is a Google reporting and visualization platform.
It is useful for creating dashboards
from connected data sources, particularly for digital marketing and website
analytics.
Best for: Marketing agencies, website owners, and businesses using
Google services.
4.
Zoho Analytics
<ins>Zoho
Analytics</ins> helps businesses connect data sources, create reports,
and build interactive dashboards.
Its integration with other Zoho
products can be useful for companies already using the Zoho ecosystem.
Best for: Small and medium-sized businesses.
5.
Qlik Cloud Analytics
<ins>Qlik Cloud
Analytics</ins> provides data exploration, reporting, and visualization capabilities
through cloud-based services.
It can help businesses explore
relationships between datasets and understand more complicated information.
Best for: Growing organizations with broader analytics requirements.
Best
Practices for Creating Business Intelligence Dashboards
Building a dashboard is not simply
about adding charts and colorful graphics. The goal is to communicate important
business information clearly.
1.
Define Your Objectives
Start by identifying the questions
your dashboard should answer.
For example:
- Are sales increasing or decreasing?
- Which products generate the most revenue?
- How much does the business spend on marketing?
- Which customer segments are most valuable?
Clear objectives help prevent
unnecessary information from appearing on the dashboard.
2.
Choose the Right KPIs
Key performance indicators (KPIs)
measure progress toward specific business objectives.
Choose metrics that are relevant,
measurable, and understandable.
A marketing dashboard might include
conversion rates and customer acquisition costs, while a financial dashboard
may focus on revenue, expenses, and profit margins.
3.
Keep the Design Simple
Avoid placing too many charts and
numbers on one screen.
Use clear headings, consistent
formatting, and appropriate visualizations. Important metrics should be easy to
find.
4.
Make Sure the Data Is Accurate
Poor-quality data can produce
misleading reports.
Businesses should regularly check
data sources, remove duplicate records, and establish consistent definitions
for important metrics.
5.
Update Dashboards Regularly
A dashboard is only useful when its
information is sufficiently current for its intended purpose.
Choose an update frequency that
matches business requirements and the capabilities of your data sources.
6.
Review Dashboard Performance
Business priorities can change over
time.
Review dashboards regularly to
remove outdated metrics, add useful information, and make sure employees are
still using the reports effectively.
Common
Mistakes to Avoid
Even a well-designed BI platform can
become ineffective when dashboards are poorly planned.
Some common mistakes include:
Too much information: Displaying every available metric makes dashboards
difficult to understand.
Unclear KPIs: Employees may interpret metrics differently if definitions
are not consistent.
Ignoring the audience: A dashboard designed for executives may not provide the
operational details needed by frontline employees.
Using inaccurate data: Incorrect information can lead to poor business decisions.
Ignoring user feedback: Employees should be able to explain which reports help them
and which information is missing.
Frequently
Asked Questions (FAQs)
What
is a business intelligence dashboard?
A business intelligence dashboard is
a visual interface that displays important business metrics, reports, and data
insights in one place.
What
are the benefits of BI dashboards?
BI dashboards help businesses
monitor performance, save reporting time, identify trends, improve
collaboration, and support data-driven decisions.
What
is the best software for creating BI dashboards?
Microsoft Power BI, Tableau, Looker
Studio, Zoho Analytics, and Qlik Cloud Analytics are popular options. The best
choice depends on budget, data sources, technical skills, and reporting
requirements.
Can
small businesses use BI dashboards?
Yes. Small businesses can use
dashboards to monitor sales, marketing, finances, inventory, and customer
service without requiring a large analytics department.
What
is the difference between a BI dashboard and a report?
A dashboard typically provides a
visual overview of important metrics, often with interactive features. A report
may provide more detailed information about a particular topic, period, or
business activity.
Are
BI dashboards updated in real time?
Some BI platforms support real-time
or near-real-time updates. Others use scheduled refreshes. The actual frequency
depends on the software, data source, and configuration.
Conclusion
Business intelligence dashboards
help organizations turn complex data into clear and useful business
information. By bringing important metrics together, dashboards make it easier
to monitor performance, identify trends, and support better decisions.
From executive and sales dashboards
to marketing, financial, and operational reports, different dashboard types can
support different business requirements.
Platforms such as Power BI, Tableau,
Looker Studio, Zoho Analytics, and Qlik Cloud Analytics provide tools for creating
interactive reports and visualizing business data.
The most effective dashboard is not
necessarily the one with the most charts or advanced features. It is the one
that presents accurate, relevant information in a simple format that helps
people take meaningful action.
As businesses continue to adopt
cloud analytics and AI-powered reporting, BI dashboards will remain an
important part of modern data-driven decision-making.
SEO
Publishing Recommendations
Category: Business Intelligence
Suggested Tags: Business Intelligence Dashboards, BI Dashboards, Data
Visualization, Business Analytics, KPI Dashboard, Business Reporting
Suggested Internal Links:
- Best Business Intelligence Software in 2026
- Best BI Tools for Small Businesses
- Free Business Intelligence Software
- Cloud Business Intelligence Software
- AI-Powered Business Intelligence
Suggested Image Alt Text: Business intelligence dashboards displaying sales
performance, financial metrics, marketing analytics, and business data
visualization.
Featured Image Concept: A professional modern office with a large computer screen
displaying clean business intelligence dashboards, sales charts, KPI
indicators, and financial analytics.



Comments
Post a Comment